FTC Solar's 2026 quarterly disclosures show revenue moving from USD 26.2 million in Q2 to USD 32.8 million in Q3, with gross margin turning positive and backlog around USD 640 million.
A turnaround narrative is easy to write and easy to overstate. The Q3 GAAP result includes non-recurring items, while adjusted EBITDA remained a loss.
This profile is built as a reusable three-period table so later quarters can be appended without rewriting the story.
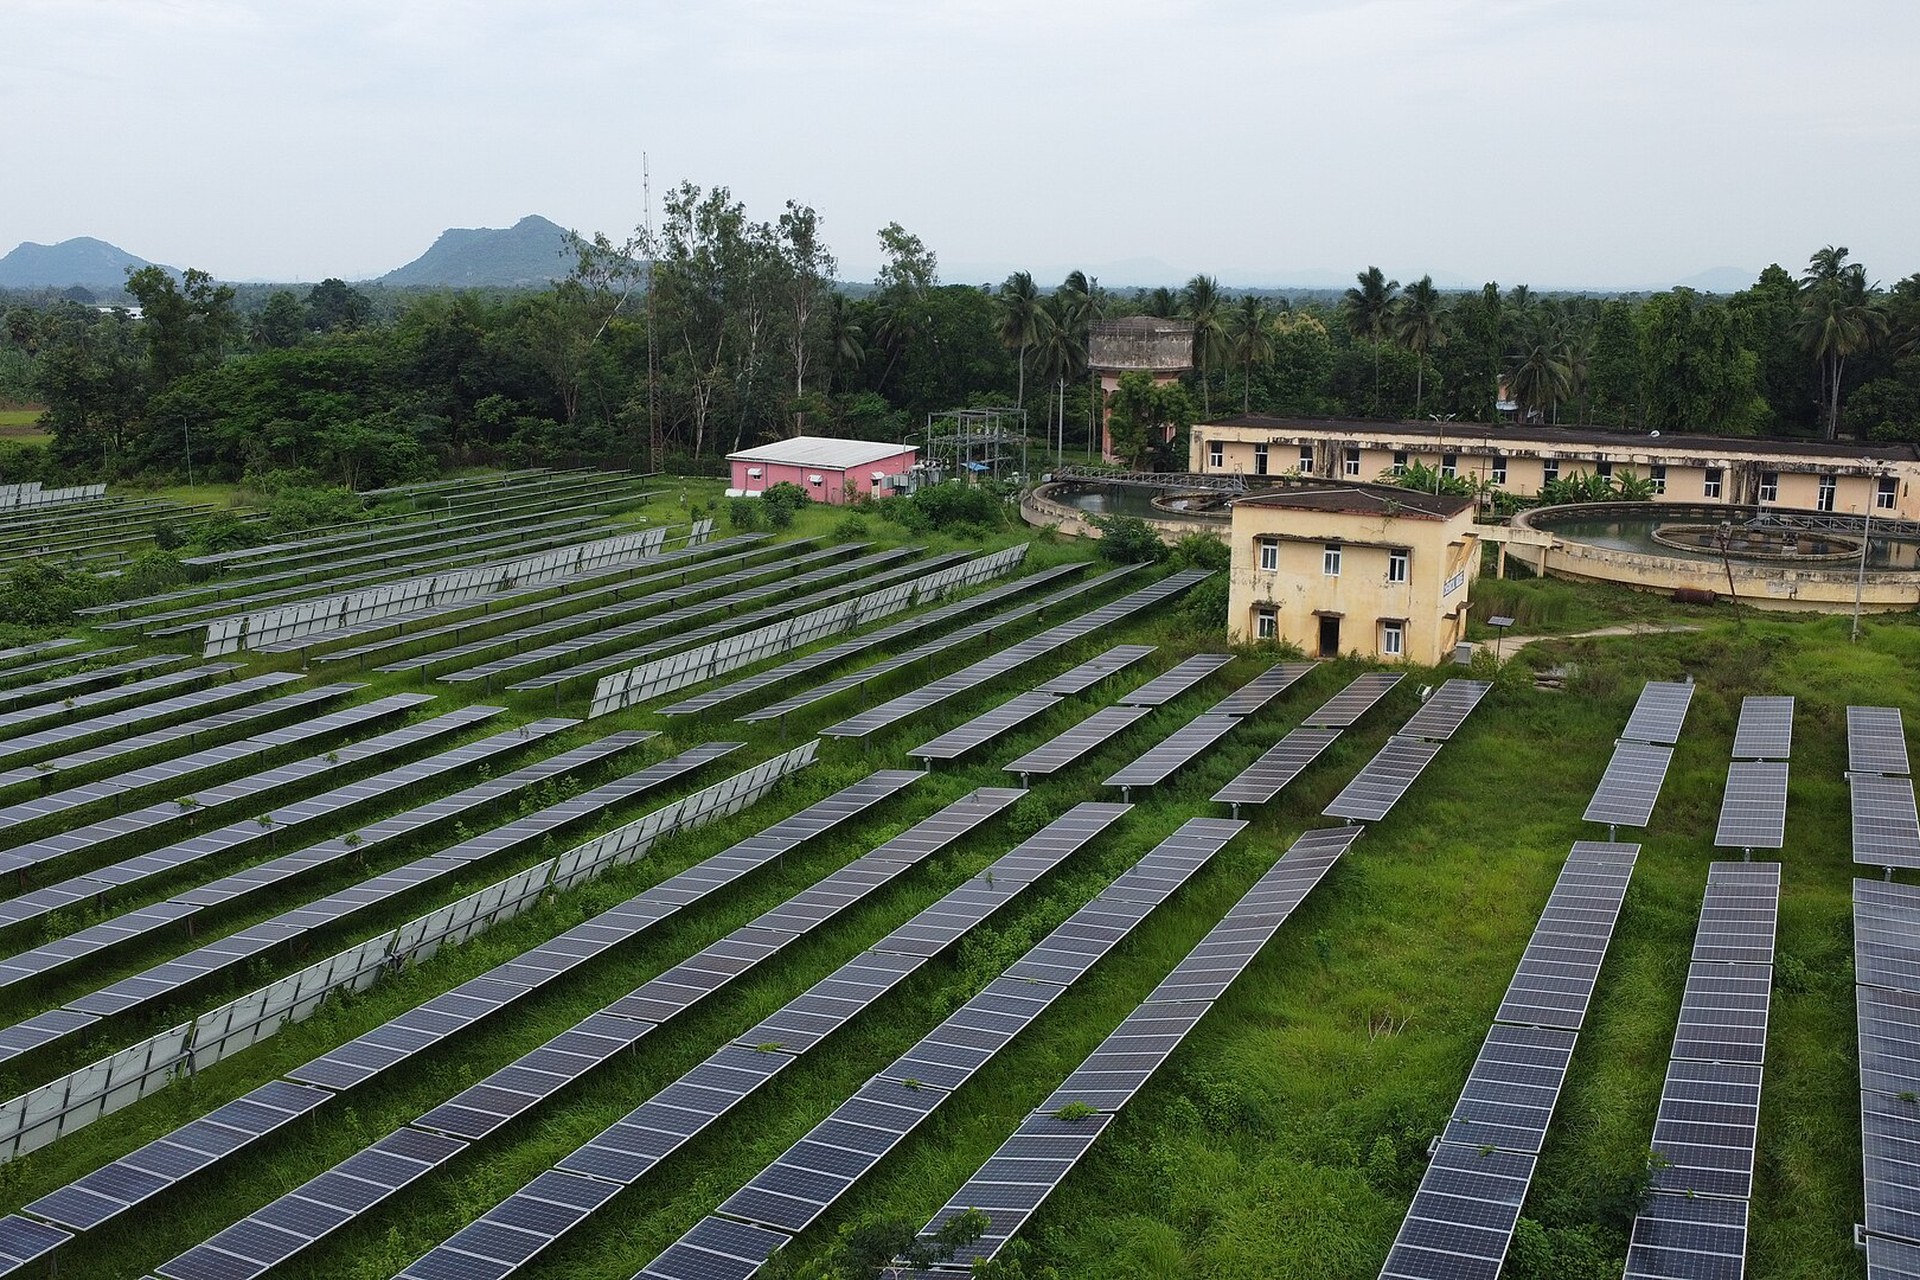
What the company does
The three-period table
Revenue, GAAP gross margin, net income, adjusted EBITDA and backlog each get their own line. Notes flag non-recurring items and the contracted-versus-awarded split in backlog.
The 2026 record
Four-market expansion
The U.S., India, the U.K. and Australia each appear with a different contract type. We link to the relevant project profiles rather than summing the capacities.
An installation-rate benchmark
A DNV-validated 81 labour hours per MW is a vendor-commissioned result for a defined installation case, not an industry baseline.
Data box
| Field | Value as reported |
|---|---|
| Q2 2026 revenue | USD 26.2 million |
| Q3 2026 revenue | USD 32.8 million, +26.1 percent year on year |
| Q3 GAAP gross margin | 5.8 percent |
| Backlog | About USD 640 million |
| Installation benchmark | 81 labour hours per MW, DNV-validated |
All figures above are quoted with the unit and reference period used by the primary source. They are reproduced here for reference, not independently re-measured.
Where the numbers stop: verification note
Q3 GAAP net income turning positive includes non-recurring factors; adjusted EBITDA was still a loss and is presented alongside it. The 81 hours per MW is a vendor-commissioned validation, not an industry standard.
What to watch next
Q4 disclosure of backlog composition and whether margin improvement persists.
Primary sources
- FTC Solar Q2 2026 results / 8-K, 2026-08-05
- FTC Solar Q3 2026 results / 8-K, 2026-11-04
- DNV installation-rate validation (81 labour hours per MW)
Researched and written by the solarrack.wiki editorial desk. Every figure in this article carries a source and a verification note; where a claim could not be confirmed against a primary document, it is labelled as such. Corrections: [email protected]